1. Choose a signal and a window
For a checkout API, propose p95 latency over a five-minute window and choose a threshold with the service owner. Explain how low request volume and absent telemetry should be treated.
FREE CLAUDE & CODEX PLUGIN TEMPLATE
Write application monitoring requirements around a real alert: what detects it, who owns it, when it escalates, and how recovery is reviewed. Download the free PRD as HTML and editable SOT JSON.
Guide updated:
View source on GitHub · MIT licensed
USE CASE
Teams designing an internal operations system for engineering or operations contributor checking service health and sre and platform operations coordinator
CONTENTS
VIBESPEC VIEWER
Each screen is generated from the public SOT included with this template.
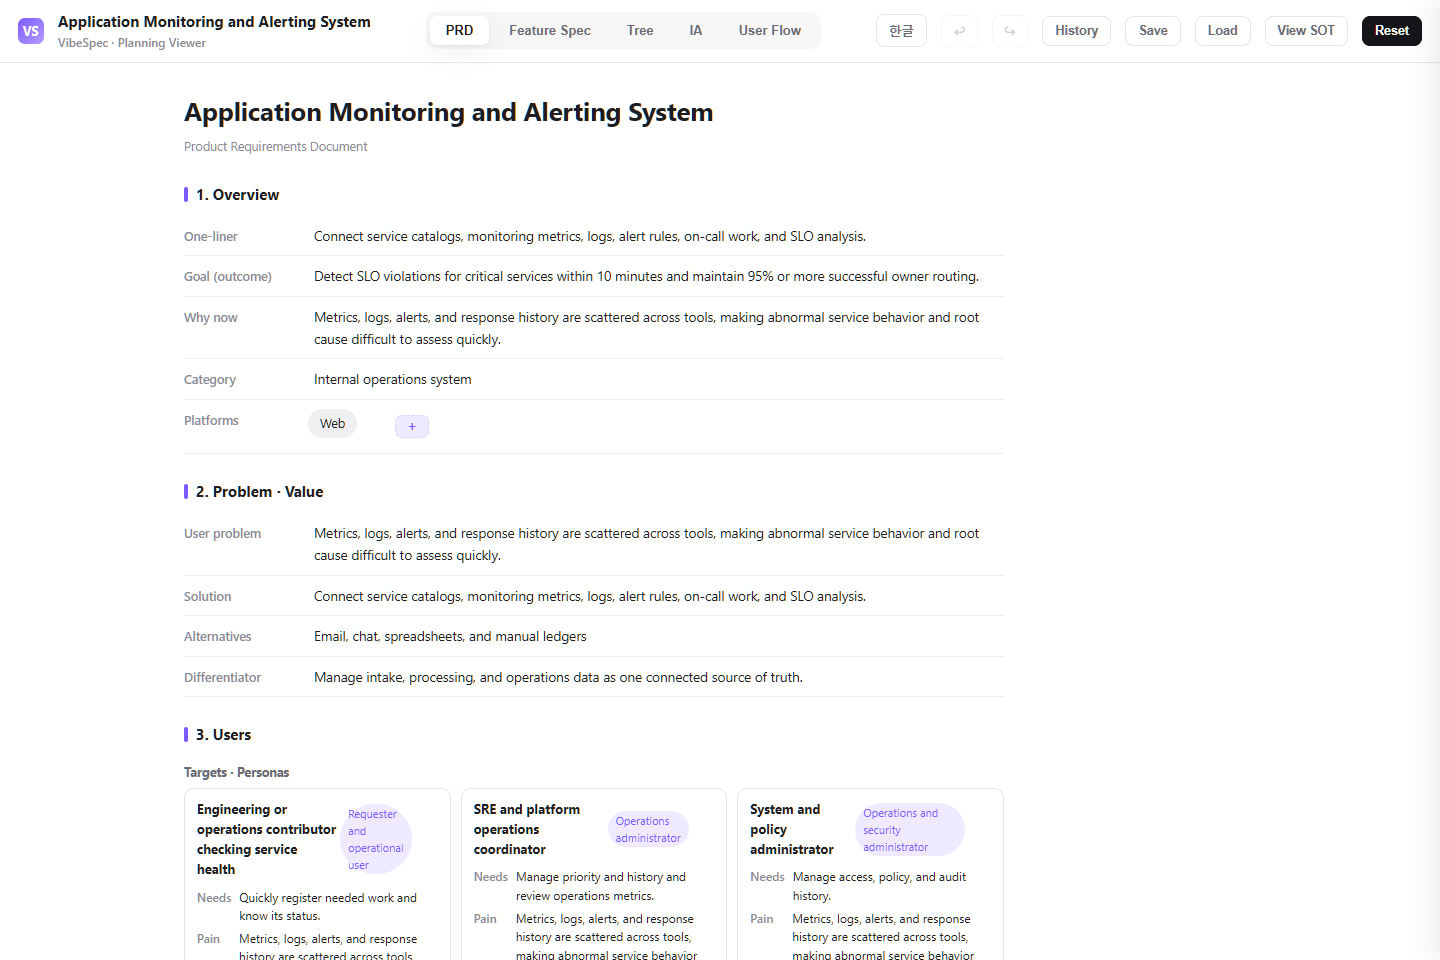 Open this screen in the live demo
 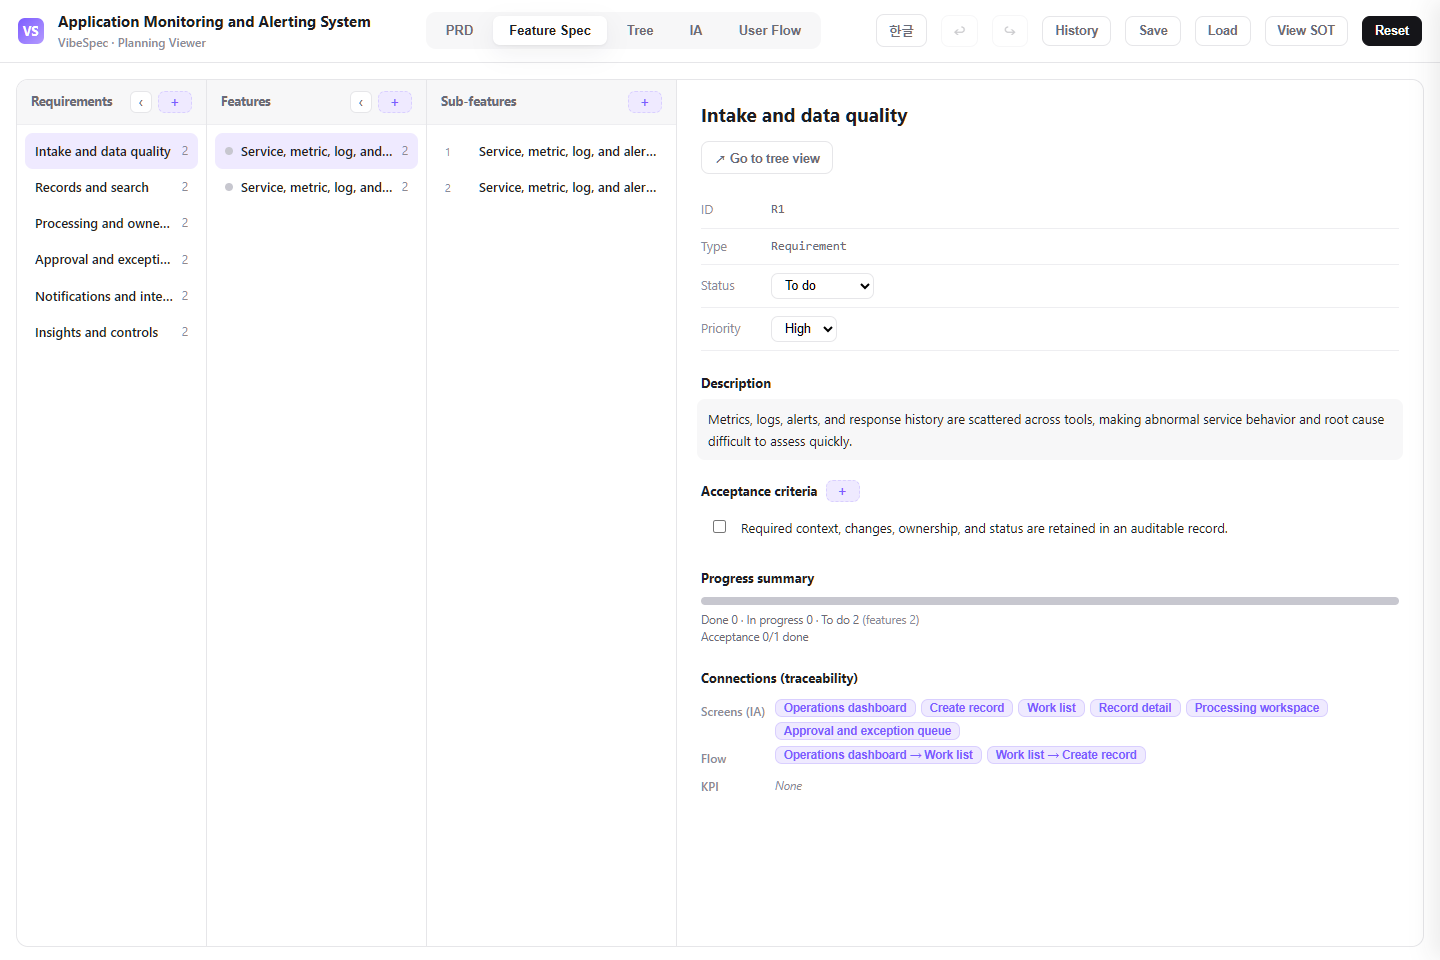 Open this screen in the live demo
 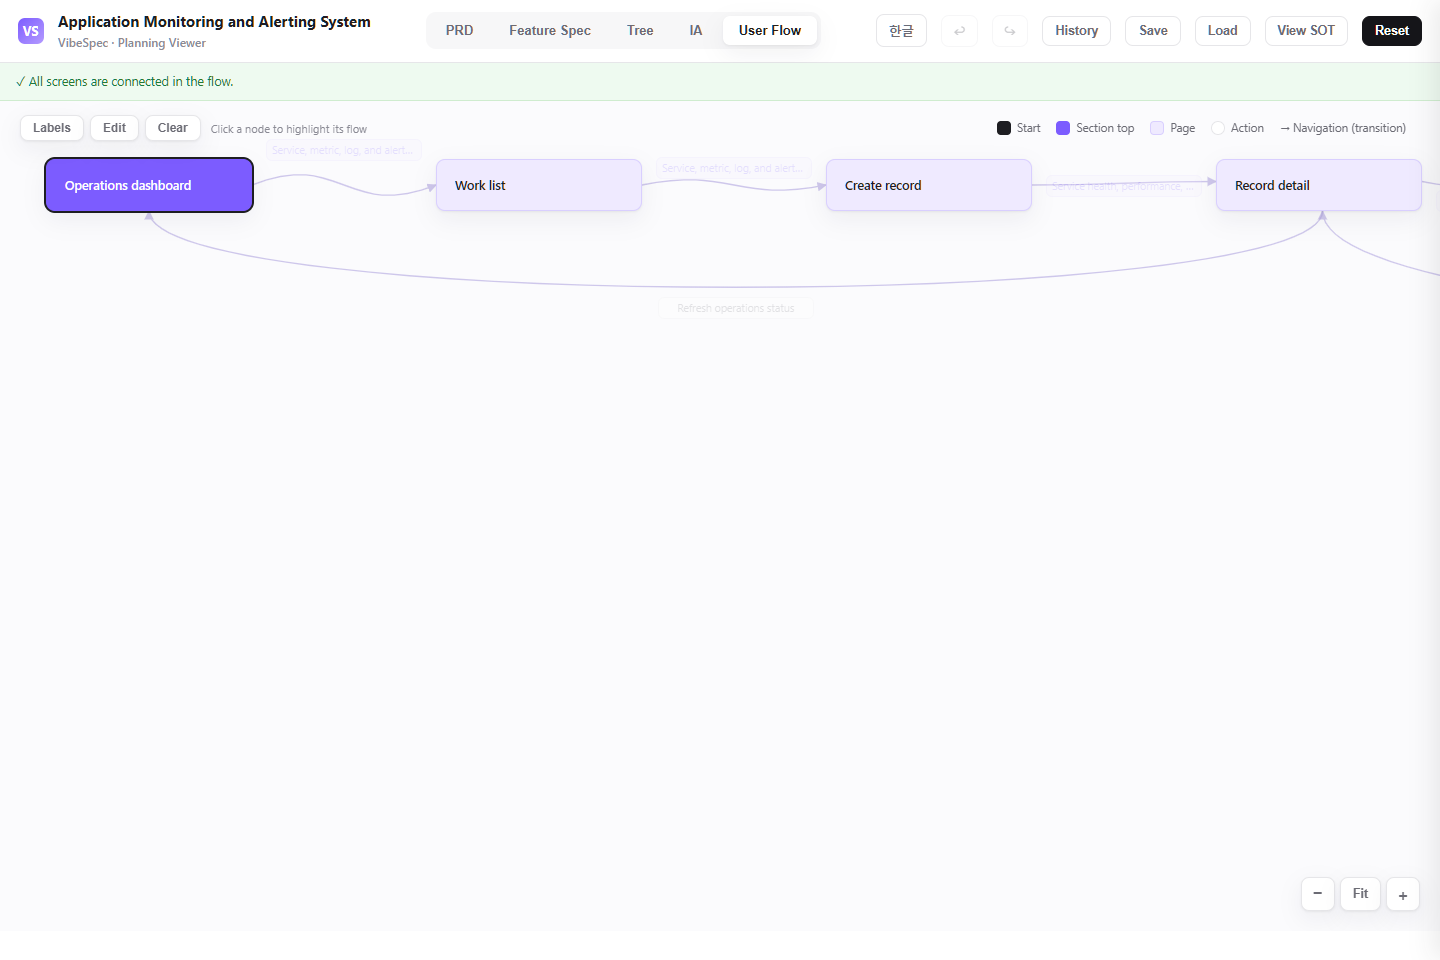 Open this screen in the live demo
 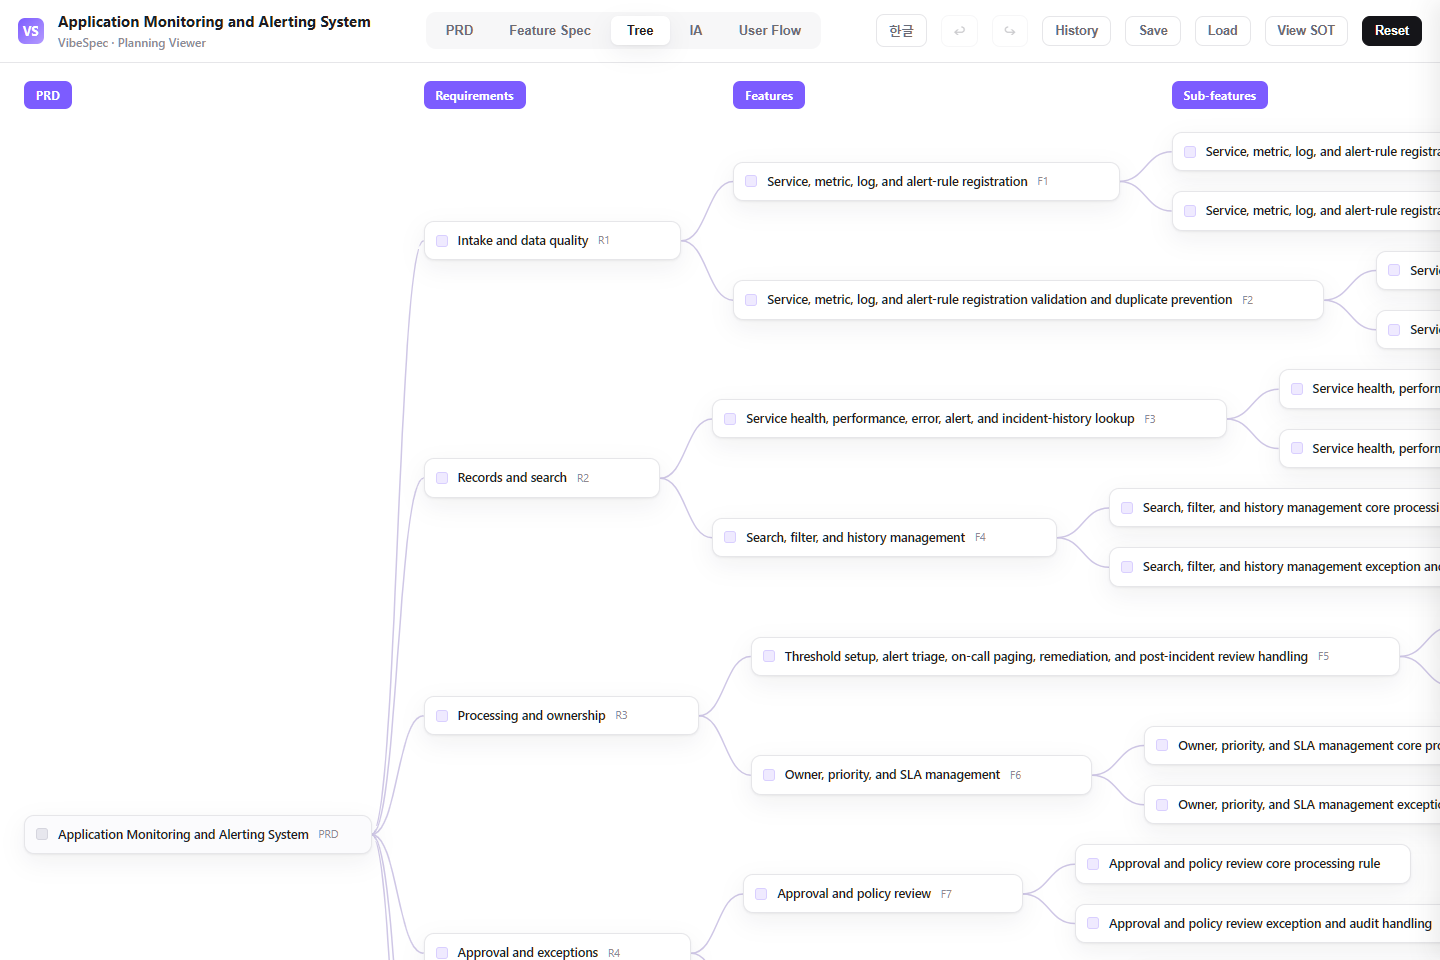 Open this screen in the live demo
 PRACTICAL GUIDE
This application monitoring PRD Template connects service and signal onboarding, alert thresholds and ownership, investigation, escalation, and incident linkage, and availability, latency, and alert-quality reporting in one operating source of truth that teams can review and extend with VibeSpec.
These are example decisions to add to your plan. The supplied SOT does not implement a telemetry collector or a working paging integration.
For a checkout API, propose p95 latency over a five-minute window and choose a threshold with the service owner. Explain how low request volume and absent telemetry should be treated.
Describe which on-call role receives the alert, how acknowledgement is recorded, and what happens after an agreed timeout. Link this decision to the alert detail and investigation flow.
Review a scenario where latency recovers but telemetry later stops. Decide whether the alert can close and which evidence the reviewer must see. Write both the normal path and the exception as acceptance criteria.
The SOT includes registration of services, metrics, logs, and alert rules. Use that scope to decide the service boundary, signal source, environment, and owner before defining an alert.
The planned workflow includes threshold setup, alert classification, and on-call paging. Decide who acknowledges an alert and what happens when the primary owner cannot respond.
The template connects service health, errors, alerts, and incident history. Review which evidence an operator needs at each step and when investigation should become a tracked incident.
Availability, latency, error rate, alert noise, and SLO reports are in scope. A report name is only a starting point: agree the time window, missing-data behavior, and calculation before implementation.
The download opens in a browser without setup. Compare the PRD, feature specification, screen structure, and user flow with the work your team does today.
Set the real team roles, approval rules, change and exception handling, and success measures before expanding the flow from service and signal onboarding through investigation, escalation, and incident linkage.
Attach the SOT JSON in Claude or Codex with the VibeSpec plugin and describe the change in plain language. VibeSpec keeps requirements, features, screens, and user flows connected.
Replace application monitoring PRD Template states, object names, owners, and approvers with the language your team actually uses.
Connect rework, approval, and evidence-retention rules for nonstandard cases to investigation, escalation, and incident linkage.
Define availability, latency, and alert-quality reporting metrics together with source-data ownership and integration failure handling.
Plan a connector to an existing metrics or logs provider. Specify service identity mapping, data freshness, access, duplicate samples, and failed ingestion before adding the integration.
Describe how a paging service receives alerts and sends acknowledgements back. Include retry, duplicate notification, and unreachable-owner cases in a separate integration plan.
Add a proposal to classify non-actionable alerts and review threshold changes. Require an owner to approve any automated remediation scope and its rollback conditions.
Using this application monitoring SOT, propose a checkout API latency alert. Ask me for the p95 threshold, evaluation window, minimum traffic, owner, acknowledgement timeout, and missing-data behavior. Mark unanswered values as open decisions. Update only the affected requirements, screens, and flows.Scope this monitoring PRD to service registration, alert rules, triage, and incident handoff. Keep telemetry ingestion, paging-provider integration, and automated remediation as separately reviewed extensions. List the boundaries clearly.Review how this plan could measure alert noise and successful owner routing. Identify the required events, denominator, and evaluation period. Do not invent measured results or claim the monitoring system is implemented.Yes. The complete HTML opens in a browser for review and sharing. To adapt the plan, attach the SOT JSON to Claude or Codex with the VibeSpec plugin and describe the change in plain language.
It includes service and signal onboarding, alert thresholds and ownership, investigation, escalation, and incident linkage, availability, latency, and alert-quality reporting, and the operating foundations for roles, access, audit, and integrations.
The HTML is a complete planning document for reading and sharing. The SOT JSON is source data that VibeSpec can update while keeping requirements, features, screens, and user flows connected.
For a discrete capability such as automation, integration, or additional analytics, create and review a separate initiative before changing the product plan broadly.
No. It is an HTML view of the monitoring PRD. Instrumentation, telemetry storage, paging integrations, and production operations need their own implementation and testing.
WORKFLOW